Bevy Renderer Perf Deep Dive 1
Let’s dive into the performance of the Bevy’s renderer. Where does time on the CPU go?
One of my favorite things to do at work is to optimize the performance of our Rust data engine. So why not take a deeper look at Bevy’s renderer performance and see what I might find?
Many Cubes Benchmark
Bevy has a built-in benchmark called many_cubes, which spawns many objects of a single color to test draw call performance.

We’ll run this with cargo build --profile release-with-debug --features bevy/trace_tracy --example many_cubes -- spheres.
Note: I have statically disabled trace! logging in my branch, as add substantial overhead in a few critical loops.
This PR discusses the issue more.
This particular example doesn’t have any lights with shadows enabled. I should probably try some profiles later with shadows enabled, those are probably a significant source of more draw calls with a slightly different path (no material changing). Same goes for the depth prepass, which isn’t merged as of me trying this!
Quick Look In Tracy
Bevy has done a great job making Tracy work great out of the box.
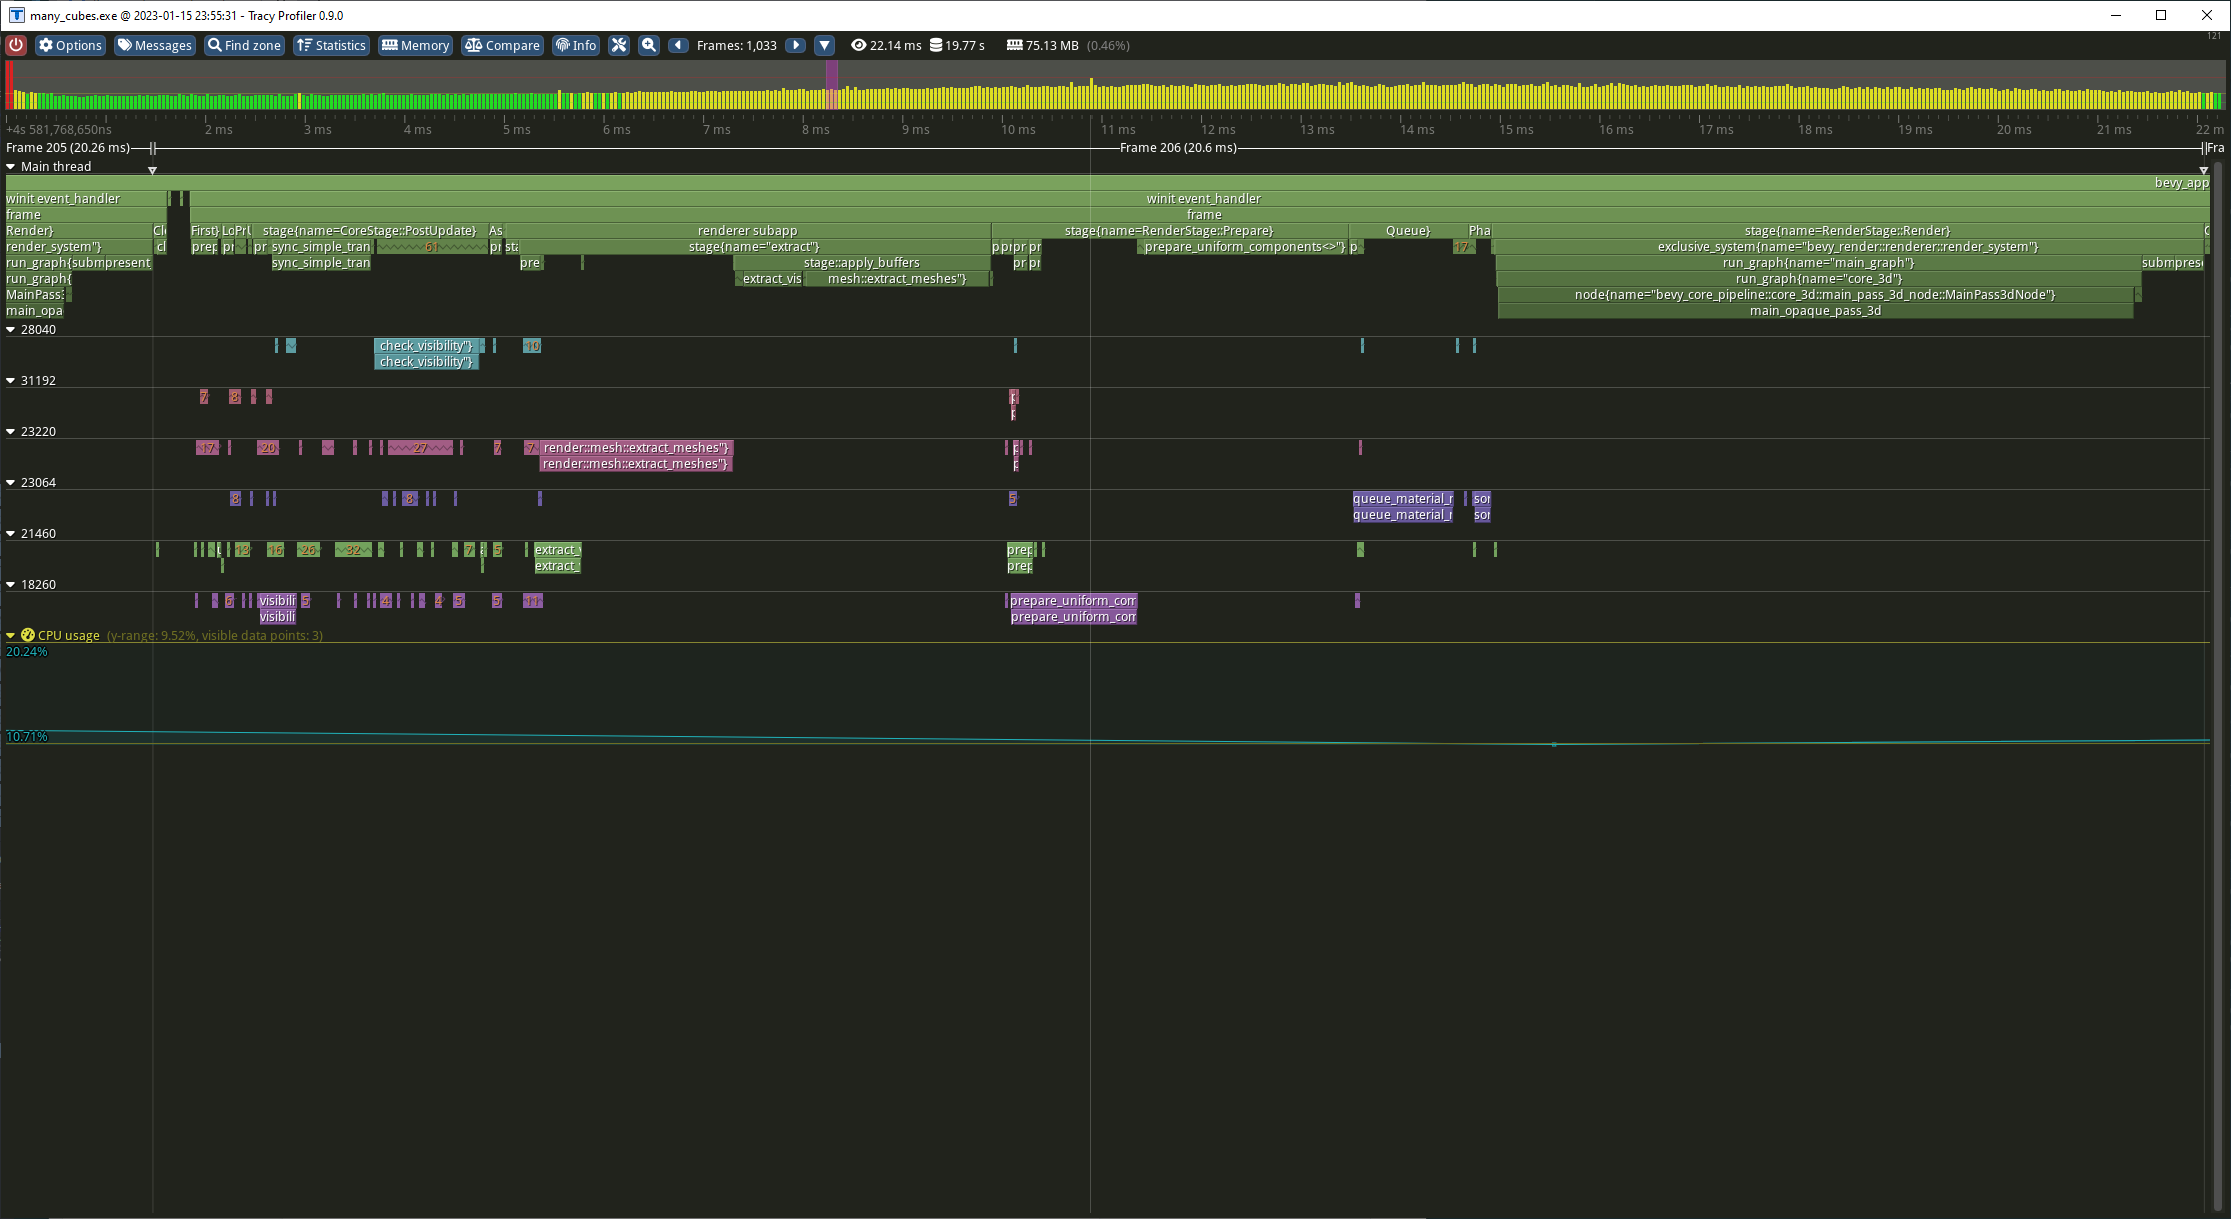
Let’s get a quick feel for where the renderer related time is being spent at a high level, which can we pull from Tracy’s “Find Zone” box.
Median Times

Frame: 20.3ms

PostUpdate: 2.65ms
    View visibility: 1.08ms

Extract: 4.87ms
    extract_meshes (system); 1.99ms
    extract_meshes (commands): 1.74ms
    extract_visible<StandardMat> (commands): 0.55ms

Prepare: 3.77ms
    prepare_uniform_components<MeshUniform> (system): 1.22ms
    prepare_uniform_components<MeshUniform> (commands): 2.33ms

Queue: 1.03ms
    queue_material_meshes: 0.79ms

Sort: 0.23ms

Render: 6.66ms
    main_opaque_pass_3d: 6.66ms
So it looks like main_opaque_pass_3d is a good candidate for a first look.
Diving Deeper With Superluminal
Unfortunately, main_opaque_pass_3d is a leaf span, so Tracy as setup isn’t going to give me any more clues.
Luckily, I have another tool in my toolbox - a sampling profiler. I really like Superluminal, so let’s fire that up. This is actually why I built my binary with debug symbols.
Armed with a capture in Superluminal, let’s go look at main_opaque_pass_3d. Unfortunately, Bevy doesn’t integrate with Superluminal yet, so we’ll have to find some way to look for it.
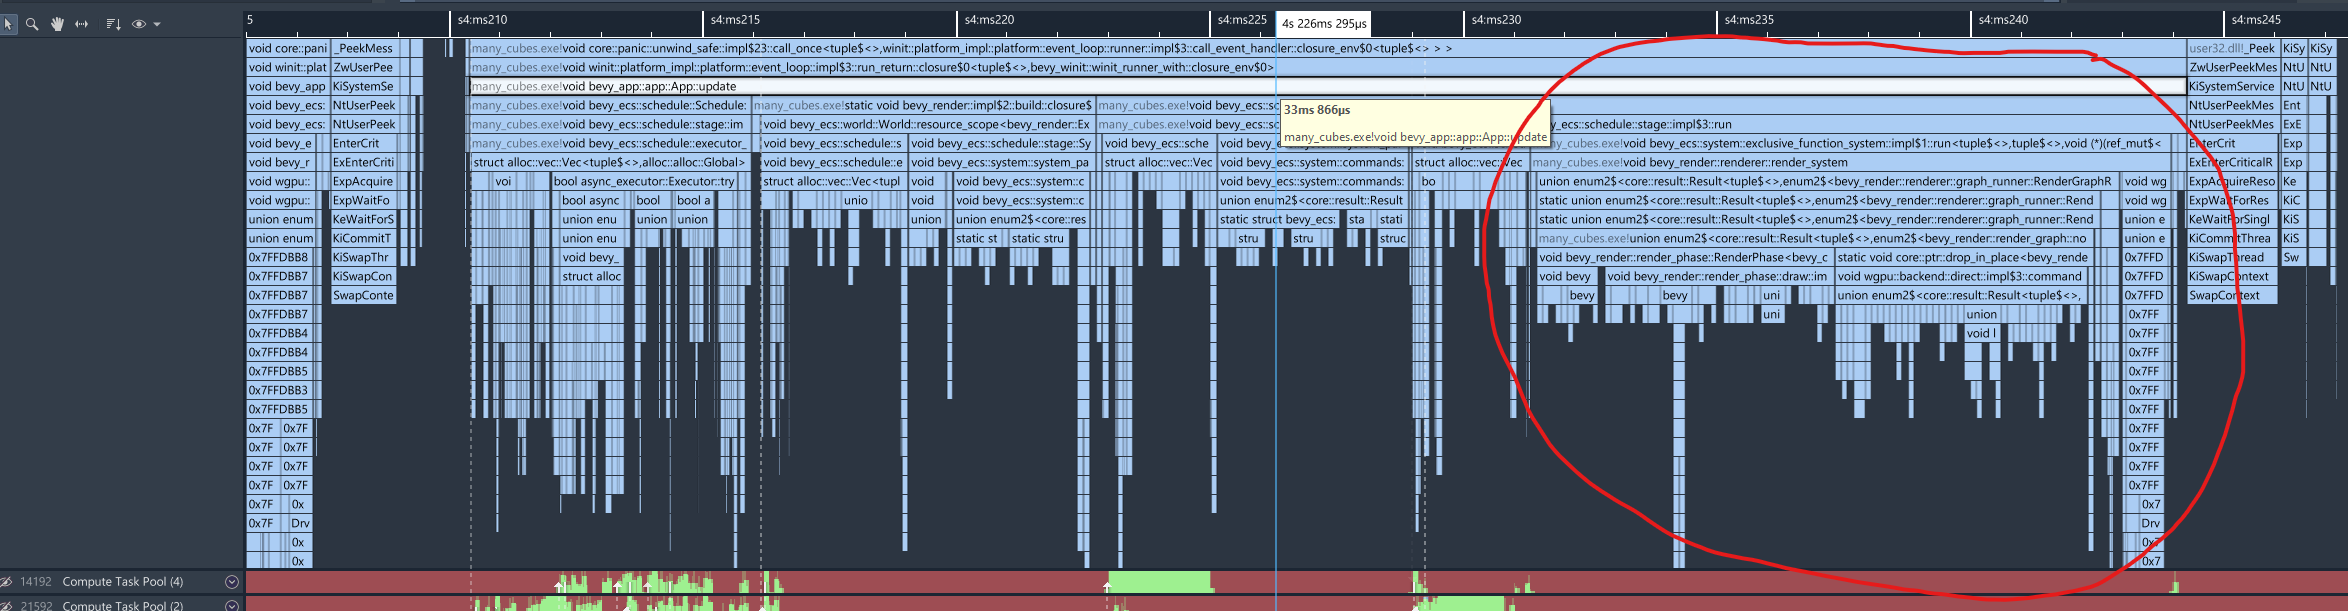
Zooming around the main thread view, I see the familiar App::update call for the frame, and circled in the image below, a group of stacks that mention RenderGraphRunner, and walking down a bit I see main_pass_3d_node::impl$1::run. Nice, that’s probably it, and we can confirm by looking at the source code and seeing the trace label. Superluminal also handily shows where time is going within a function in the source pane, which I’ve copied here.
 51 |                  | fn run(
 52 |                  |     &self,
 53 |                  |     graph: &mut RenderGraphContext,
 54 |                  |     render_context: &mut RenderContext,
 55 |                  |     world: &World,
 56 |                  | ) -> Result<(), NodeRunError> {
 57 |                  |     let view_entity = graph.get_input_entity(Self::IN_VIEW)?;
 58 |                  |     let (camera, opaque_phase, alpha_mask_phase, transparent_phase, camera_3d, target, depth) =
 59 |                  |         match self.query.get_manual(world, view_entity) {
 60 |                  |             Ok(query) => query,
 61 |                  |             Err(_) => {
 62 |                  |                 return Ok(());
 63 |                  |             } // No window
 64 |                  |         };
 65 |                  |
 66 |                  |     // Always run opaque pass to ensure screen is cleared
 67 |                  |     {
 68 |                  |         // Run the opaque pass, sorted front-to-back
 69 |                  |         // NOTE: Scoped to drop the mutable borrow of render_context
 70 |                  |         #[cfg(feature = "trace")]
 71 |                  |         let _main_opaque_pass_3d_span = info_span!("main_opaque_pass_3d").entered();
 72 |                  |
 73 |                  |         let mut render_pass = render_context.begin_tracked_render_pass(RenderPassDescriptor {
 74 |                  |             label: Some("main_opaque_pass_3d"),
 75 |                  |             // NOTE: The opaque pass loads the color
 76 |                  |             // buffer as well as writing to it.
 77 |                  |             color_attachments: &[Some(target.get_color_attachment(Operations {
 78 |                  |                 load: match camera_3d.clear_color {
 79 |                  |                     ClearColorConfig::Default => {
 80 |                  |                         LoadOp::Clear(world.resource::<ClearColor>().0.into())
 81 |                  |                     }
 82 |                  |                     ClearColorConfig::Custom(color) => LoadOp::Clear(color.into()),
 83 |                  |                     ClearColorConfig::None => LoadOp::Load,
 84 |                  |                 },
 85 |                  |                 store: true,
 86 |                  |             }))],
 87 |                  |             depth_stencil_attachment: Some(RenderPassDepthStencilAttachment {
 88 |                  |                 view: &depth.view,
 89 |                  |                 // NOTE: The opaque main pass loads the depth buffer and possibly overwrites it
 90 |                  |                 depth_ops: Some(Operations {
 91 |                  |                     // NOTE: 0.0 is the far plane due to bevy's use of reverse-z projections.
 92 |                  |                     load: camera_3d.depth_load_op.clone().into(),
 93 |                  |                     store: true,
 94 |                  |                 }),
 95 |                  |                 stencil_ops: None,
 96 |                  |             }),
 97 |                  |         });
 98 |                  |
 99 |                  |         if let Some(viewport) = camera.viewport.as_ref() {
100 |                  |             render_pass.set_camera_viewport(viewport);
101 |                  |         }
102 |                  |
103 | 53%  (5ms 883µs) |         opaque_phase.render(&mut render_pass, world, view_entity);
104 | 46%  (5ms 110µs) |     }
Interesting, 53% in opaque_phase.render, and 46% at the end, probably in a Drop.
The call graph tells us more:
  Function                                                                                                                                                          Module      Inclusive Time  Exclusive Time
--------------------------------------------------------------------------------------------------------------------------------------------------------------------------------------------------------------
  union enum2$<core::result::Result<tuple$<>,enum2$<bevy_render::render_graph::node::NodeRunError> > > bevy_core_pipeline::core_3d::main_pass_3d_node::impl$1::run  many_cubes  11.00           0.00
     void bevy_render::render_phase::RenderPhase<bevy_core_pipeline::core_3d::Opaque3d>::render<bevy_core_pipeline::core_3d::Opaque3d>                              many_cubes  5.88            0.12
     static void core::ptr::drop_in_place<bevy_render::render_phase::draw_state::TrackedRenderPass>                                                                 many_cubes  5.11            0.00
Let’s look at what RenderPhase<bevy_core_pipeline::core_3d::Opaque3d> is up to first. Click on it in the Call Graph, brings up the trusty source view again
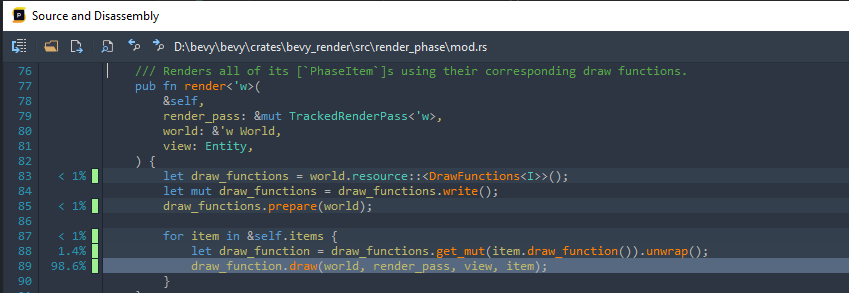
For context, in my capture we spent 1097ms in render. The code timings that follow are relative to this time.
Digging in one level deeper:
252 | 0.19348%   (2ms 77µs)    |     fn draw<'w>(
253 |                          |         &mut self,
254 |                          |         world: &'w World,
255 |                          |         pass: &mut TrackedRenderPass<'w>,
256 |                          |         view: Entity,
257 |                          |         item: &P,
258 |                          |     ) {
259 | 5.00536%   (53ms 742µs)  |         let param = self.state.get(world);
260 | 9.19531%   (98ms 729µs)  |         let view = self.view.get_manual(world, view).unwrap();
261 | 23.79300%  (255ms 464µs) |         let entity = self.entity.get_manual(world, item.entity()).unwrap();
262 |                          |         // TODO: handle/log `RenderCommand` failure
263 | 61.48572%  (660ms 168µs) |         C::render(item, view, entity, param, pass);
264 | 0.29667%   (3ms 185µs)   |     }
265 |                          | }
Well that’s interesting. We spend 9% on getting the view entity, and 24% on getting the item entity (!). That said, the bulk of the time (61%) is spent in C::render, so let’s make sure to come back to that.
Expensive Entity Lookups
I don’t see get_manual in the call graph, but there’s get_unchecked_manual - get_manual is annotated with #[inline] so that’s not surprising. Looking at that:
387 | 0.86945%   (1ms 953µs)   |  pub(crate) unsafe fn get_unchecked_manual<'w>(
388 |                          |      &self,
389 |                          |      world: &'w World,
390 |                          |      entity: Entity,
391 |                          |      last_change_tick: u32,
392 |                          |      change_tick: u32,
393 |                          |  ) -> Result<Q::Item<'w>, QueryEntityError> {
394 | 79.46919%  (178ms 570µs) |      let location = world
395 |                          |          .entities
396 |                          |          .get(entity)
397 |                          |          .ok_or(QueryEntityError::NoSuchEntity(entity))?;
398 | 6.52084%   (14ms 652µs)  |      if !self
399 |                          |          .matched_archetypes
400 |                          |          .contains(location.archetype_id.index())
401 |                          |      {
402 |                          |          return Err(QueryEntityError::QueryDoesNotMatch(entity));
403 |                          |      }
404 | 1.46719%   (3ms 296µs)   |      let archetype = world
405 |                          |          .archetypes
406 |                          |          .get(location.archetype_id)
407 |                          |          .debug_checked_unwrap();
408 | 0.48361%   (1ms 86µs)    |      let mut fetch = Q::init_fetch(world, &self.fetch_state, last_change_tick, change_tick);
409 | 0.53568%   (1ms 203µs)   |      let mut filter = F::init_fetch(world, &self.filter_state, last_change_tick, change_tick);
410 |                          |
411 |                          |      let table = world
412 |                          |          .storages()
413 |                          |          .tables
414 |                          |          .get(location.table_id)
415 |                          |          .debug_checked_unwrap();
416 | 7.98803%   (17ms 949µs)  |      Q::set_archetype(&mut fetch, &self.fetch_state, archetype, table);
417 |                          |      F::set_archetype(&mut filter, &self.filter_state, archetype, table);
418 |                          |
419 |                          |      if F::filter_fetch(&mut filter, entity, location.table_row) {
420 | 1.52153%   (3ms 418µs)   |          Ok(Q::fetch(&mut fetch, entity, location.table_row))
421 |                          |      } else {
422 |                          |          Err(QueryEntityError::QueryDoesNotMatch(entity))
423 |                          |      }
424 | 1.14115%   (2ms 564µs)   |  }
Huh, 79% in getting the entity location. What’s going on there?
567 |                          |  pub fn get(&self, entity: Entity) -> Option<EntityLocation> {
568 | 0.82023%   (1ms 450µs)   |      if (entity.index as usize) < self.meta.len() {
569 |                          |          let meta = &self.meta[entity.index as usize];
570 | 95.07861%  (168ms 157µs) |          if meta.generation != entity.generation
571 |                          |              || meta.location.archetype_id == ArchetypeId::INVALID
572 |                          |          {
573 |                          |              return None;
574 |                          |          }
575 | 3.89610%   (6ms 890µs)   |          Some(meta.location)
576 |                          |      } else {
577 |                          |          None
578 |                          |      }
579 | 0.20506%   (362µs)       |  }
All the time is appears to be spent in the if statement comparing 2 u32s. I suspect this actually misleading - it’s not actually the u32 compares that are expensive - rather than this is the first time we’re accessing the data in the meta: Vec<EntityMeta>, and we’re seeing the penalty of memory access. Likely, our lookups are random and self.meta doesn’t fit into caches very well.
The Render Command
Walking back a bit, earlier we had noted that 61% of time was spent in RenderCommand::render. So let’s dive into that now.
Looking at the call graph, it looks like the two main culprits are DrawMesh::render (47%) and TrackedRenderPass::set_bind_group (17%).
Let’s look at DrawMesh::render first:
937 |                          | pub struct DrawMesh;
938 |                          | impl<P: PhaseItem> RenderCommand<P> for DrawMesh {
939 |                          |     type Param = SRes<RenderAssets<Mesh>>;
940 |                          |     type ViewWorldQuery = ();
941 |                          |     type ItemWorldQuery = Read<Handle<Mesh>>;
942 |                          |     #[inline]
943 | 0.74875%   (2ms 306µs)   |     fn render<'w>(
944 |                          |         _item: &P,
945 |                          |         _view: (),
946 |                          |         mesh_handle: ROQueryItem<'_, Self::ItemWorldQuery>,
947 |                          |         meshes: SystemParamItem<'w, '_, Self::Param>,
948 |                          |         pass: &mut TrackedRenderPass<'w>,
949 |                          |     ) -> RenderCommandResult {
950 | 57.81142%  (178ms 109µs) |         if let Some(gpu_mesh) = meshes.into_inner().get(mesh_handle) {
951 | 3.37612%   (10ms 401µs)  |             pass.set_vertex_buffer(0, gpu_mesh.vertex_buffer.slice(..));
952 | 0.39408%   (1ms 214µs)   |             match &gpu_mesh.buffer_info {
953 |                          |                 GpuBufferInfo::Indexed {
954 |                          |                     buffer,
955 |                          |                     index_format,
956 |                          |                     count,
957 |                          |                 } => {
958 | 3.62607%   (11ms 171µs)  |                     pass.set_index_buffer(buffer.slice(..), 0, *index_format);
959 | 33.24800%  (102ms 432µs) |                     pass.draw_indexed(0..*count, 0, 0..1);
960 |                          |                 }
Oof, 58% (16% of opaque 3d RenderPhase<opaque_3d>::render) in meshes.into_inner().get(mesh_handle), which is a HashMap lookup.
What about wgpu::RenderPass::draw_indexed? Let’s take a look out of curiosity. Looking at the callgraph view again, it looks ~70% is spent in RawVec<>::reserve_for_push i.e. resizing the vector.
Dropping TrackedRenderPass
Earlier, we noted we spent 53% in RenderPhase<opaque_3d>::render, and 46% at the end in dropping TrackedRenderPass.
Let’s look at what’s up with TrackedRenderPass now, why is dropping it so expensive?
Turns out, dropping the render pass also triggers ending the wgpu render pass. Digging in more:
1087 | 0.01200%   (139µs)       | pub fn command_encoder_run_render_pass_impl<A: HalApi>(
1088 |                          |     &self,
1089 |                          |     encoder_id: id::CommandEncoderId,
1090 |                          |     base: BasePassRef<RenderCommand>,
1091 |                          |     color_attachments: &[Option<RenderPassColorAttachment>],
1092 |                          |     depth_stencil_attachment: Option<&RenderPassDepthStencilAttachment>,
1093 |                          | ) -> Result<(), RenderPassError> {
1094 | 0.04187%   (487µs)       |     profiling::scope!("CommandEncoder::run_render_pass");
<snip>
1216 |                          |      // merge the resource tracker in
1217 |                          |      unsafe {
1218 | 24.31980%  (282ms 987µs) |          info.usage_scope
1219 |                          |              .merge_bind_group(&*texture_guard, &bind_group.used)
1220 |                          |              .map_pass_err(scope)?;
1221 |                          |      }
<snip>
1242 | 25.15580%  (292ms 715µs) |      let entries = state.binder.assign_group(
1243 |                          |          index as usize,
1244 |                          |          id::Valid(bind_group_id),
1245 |                          |          bind_group,
1246 | 0.01200%   (139µs)       |          &temp_offsets,
1247 |                          |      );
<snip>
1654 |                          |      unsafe {
1655 | 14.94690%  (173ms 923µs) |          raw.draw_indexed(
1656 |                          |              first_index,
1657 |                          |              index_count,
1658 |                          |              base_vertex,
1659 |                          |              first_instance,
1660 |                          |              instance_count,
1661 |                          |          );
1662 |                          |      }
So, ~50% in what appears to be some sort of state/resource tracking, and 15% on the actual raw API.
Conclusion
We looked really closely at the opaque 3d render phase here, which is about 40% of the extract/prepare/queue/sort/render steps. In future I hope to examine the other steps in greater detail.
Some takeaways:
- The ECS entity lookups in the draw loop (view + item)is really expensive! It is ~33% of the opaque 3d RenderPhase, 17.5% of the main_pass_3d_node.
- The GPU mesh HashMap lookup is no slouch either, at 16% of the opaque 3d RenderPhase, ~8.5% of the main_pass_3d_node.
- If we can get the wgpu render pass command encoder to re-use its command vector, we could maybe save on the 10% of the opaque 3d RenderPhase we’re paying for resizing it.
- Something like 60% of the main_pass_3d_node cost is in wgpu code, so barring substantial improvements on the wgpu side, this code is somewhat unavoidable. We either have to reduce draw calls via batching and/or try and parallelize command buffer recording.