Bevy Renderer Perf Deep Dive 2: Revisiting drop TrackedRenderPass
This is part 2 of a series where I look at where CPU time is spent in Bevy’s renderer loop, with an eye towards finding perf opportunities.
Revisiting wgpu command_encoder_end_render_pass
In part 1 I noted that when dropping TrackedRenderPass, we were spending 50% in some sort of state/resource tracking in wgpu, and didn’t dig in any deeper.
1087 | 0.01200%   (139µs)       | pub fn command_encoder_run_render_pass_impl<A: HalApi>(
1088 |                          |     &self,
1089 |                          |     encoder_id: id::CommandEncoderId,
1090 |                          |     base: BasePassRef<RenderCommand>,
1091 |                          |     color_attachments: &[Option<RenderPassColorAttachment>],
1092 |                          |     depth_stencil_attachment: Option<&RenderPassDepthStencilAttachment>,
1093 |                          | ) -> Result<(), RenderPassError> {
1094 | 0.04187%   (487µs)       |     profiling::scope!("CommandEncoder::run_render_pass");
<snip>
1216 |                          |      // merge the resource tracker in
1217 |                          |      unsafe {
1218 | 24.31980%  (282ms 987µs) |          info.usage_scope
1219 |                          |              .merge_bind_group(&*texture_guard, &bind_group.used)
1220 |                          |              .map_pass_err(scope)?;
1221 |                          |      }
<snip>
1242 | 25.15580%  (292ms 715µs) |      let entries = state.binder.assign_group(
1243 |                          |          index as usize,
1244 |                          |          id::Valid(bind_group_id),
1245 |                          |          bind_group,
1246 | 0.01200%   (139µs)       |          &temp_offsets,
1247 |                          |      );
<snip>
1654 |                          |      unsafe {
1655 | 14.94690%  (173ms 923µs) |          raw.draw_indexed(
1656 |                          |              first_index,
1657 |                          |              index_count,
1658 |                          |              base_vertex,
1659 |                          |              first_instance,
1660 |                          |              instance_count,
1661 |                          |          );
1662 |                          |      }
I decided to dig in a little more, and found something surprising:
  Function                                                                                                                       Inclusive Time  Exclusive Time
-----------------------------------------------------------------------------------------------------------------------------------------------------------------
  static void core::ptr::drop_in_place<bevy_render::render_phase::draw_state::TrackedRenderPass>                                                                                                                                                                                                                      many_cubes    1196.26         1.62
     void wgpu::backend::direct::impl$3::command_encoder_end_render_pass                                                         1163.73         0.12
        wgpu_core::...::command_encoder_run_render_pass_impl<wgpu_core::hub::IdentityManagerFactory,wgpu_hal::vulkan::Api>       1163.61         168.17
           wgpu_core::...::assign_group<wgpu_hal::vulkan::Api>                                                                   289.64          44.79
              void log::__private_api_log                                                                                        198.31          34.54
              void wgpu_core::impl$5::drop                                                                                       18.95           18.95
              struct core::ops::range::Range<usize> wgpu_core::command::bind::compat::Manager<_>::make_range<_>                  10.93           10.93
              memcpy                                                                                                             9.00            9.00
              struct wgpu_core::RefCount wgpu_core::LifeGuard::add_ref                                                           7.54            7.54
              void alloc::raw_vec::impl$1::reserve::do_reserve_and_handle<f32,alloc::alloc::Global>                              0.12            0.00
           wgpu_core::...::merge_bind_group<wgpu_hal::vulkan::Api>                                                               267.82          36.06
              void log::__private_api_log                                                                                        230.41          46.43
What is this log::__private_api_log that looks to be taking up a good chunk of the time?
228 | 2.88893%   (8ms 367µs)   | pub(super) fn assign_group<'a, A: HalApi>(
229 |                          |     &'a mut self,
230 |                          |     index: usize,
231 |                          |     bind_group_id: Valid<BindGroupId>,
232 |                          |     bind_group: &BindGroup<A>,
233 |                          |     offsets: &[wgt::DynamicOffset],
234 |                          | ) -> &'a [EntryPayload] {
235 | 70.20786%  (203ms 351µs) |     log::trace!("\tBinding [{}] = group {:?}", index, bind_group_id);
236 |                          |     debug_assert_eq!(A::VARIANT, bind_group_id.0.backend());
237 |                          |
238 | 0.89217%   (2ms 584µs)   |     let payload = &mut self.payloads[index];
239 | 7.77605%   (22ms 522µs)  |     payload.group_id = Some(Stored {
240 | 0.63726%   (1ms 845µs)   |         value: bind_group_id,
241 | 2.85767%   (8ms 277µs)   |         ref_count: bind_group.life_guard.add_ref(),
242 |                          |     });
Ack! We’re paying for trace logging, even though we’ve not enabled it. Trace logging can be very expensive to leave in super tight loops like this.
Luckily, the log crate gives us a way to statically disable logging of a certain level. Throwing in a quick
log = { version = "0.4", default-features = false, features=["release_max_level_debug"]}
into our Cargo.toml, let’s see how the profile looks before / after.
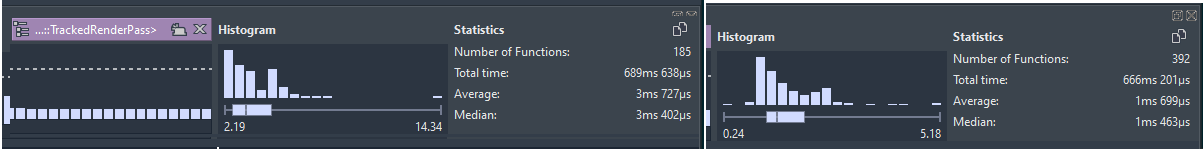
So we’ve managed to make drop_in_place<bevy_render::render_phase::draw_state::TrackedRenderPass> go from 3.4ms per frame to 1.5ms, a 2.2X speedup.
This bring the main_pass_3d_node::run median time per frame from 6.3ms -> 3.5ms (!).
Next Steps
Discuss whether wgpu should be putting these expensive log lines behind some sort of #[cfg()] attribute. Otherwise, we’ll have to make sure users make sure to compile release mode with the release_max_level_debug feature above - the performance cost otherwise appears to be great!